Figma's Journey to a 0B Business: A 9-Year Timeline
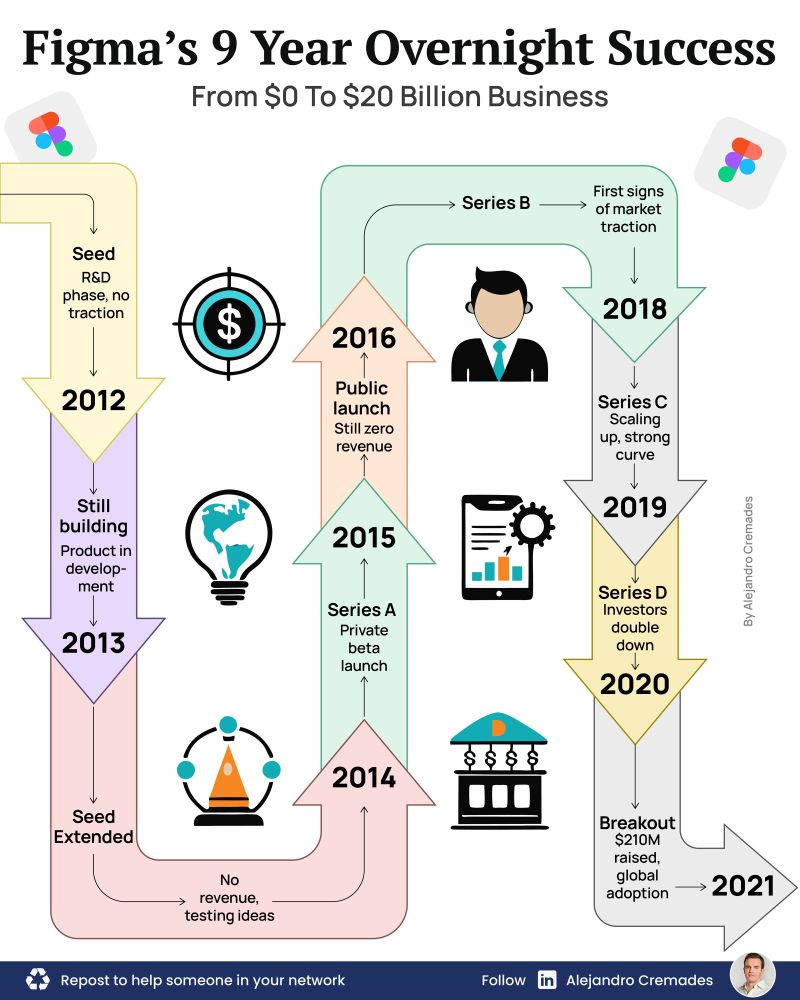
This infographic details Figma's growth from its R&D phase in 2012 to its 0 billion valuation in 2021, highlighting key milestones like funding rounds, public launch, and market traction. It offers founders a visual guide to the iterative and often lengthy process of building a successful startup.
This infographic details Figma's growth from its R&D phase in 2012 to its 0 billion valuation in 2021, highlighting key milestones like funding rounds, publi…
Tags: startup journey, figma, funding rounds, growth timeline, market traction, product development, business milestones, startup scaling
View on Startup Fundraising ·
More Startups visuals ·
Browse all visuals